Sales | Insight
Analyze all of your imported Poshmark Sales Data!

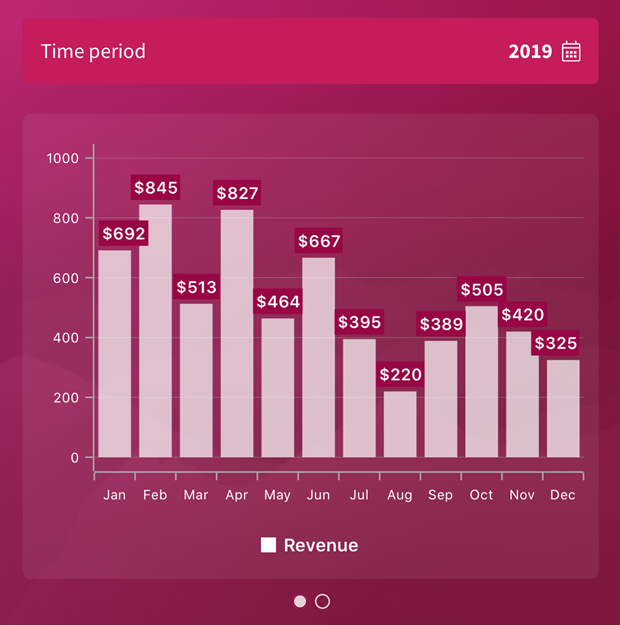
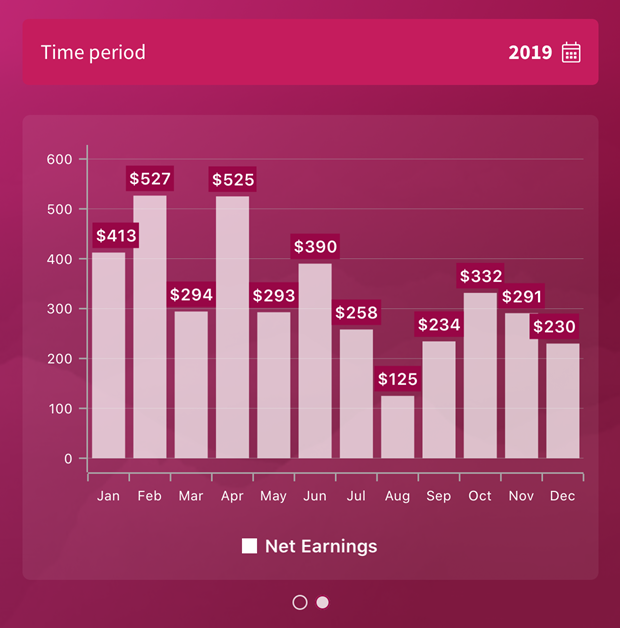
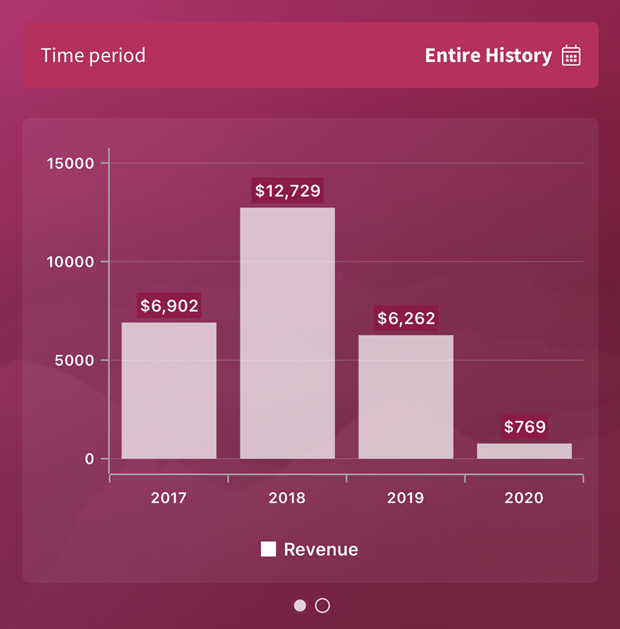
Visualize the total revenue and profit of your entire Poshmark closet!
Analyze all of your imported Poshmark Sales Data!
Visualize the total revenue and profit of your entire Poshmark closet!
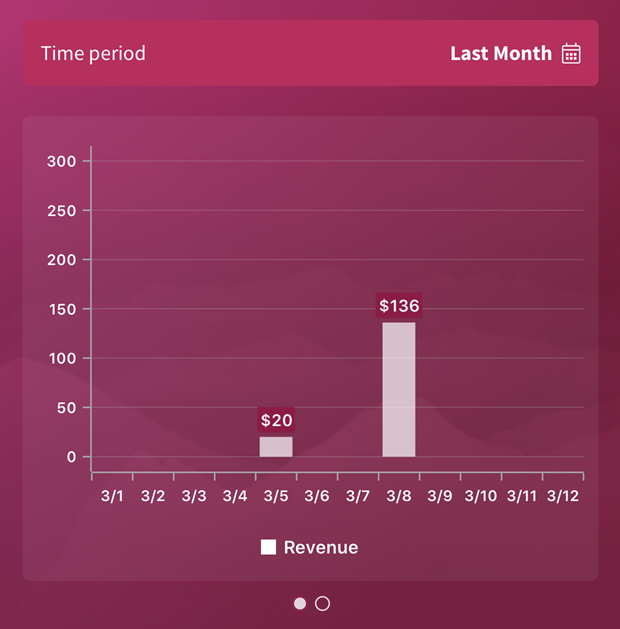
Simply swipe the chart over to quickly cycle between your Revenue and Profit for the same time period.
Let's see what else you can learn from your sales data!
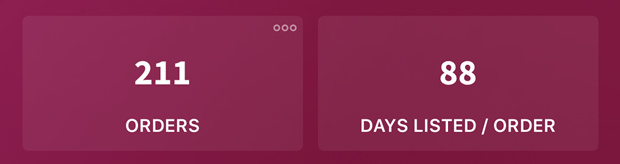
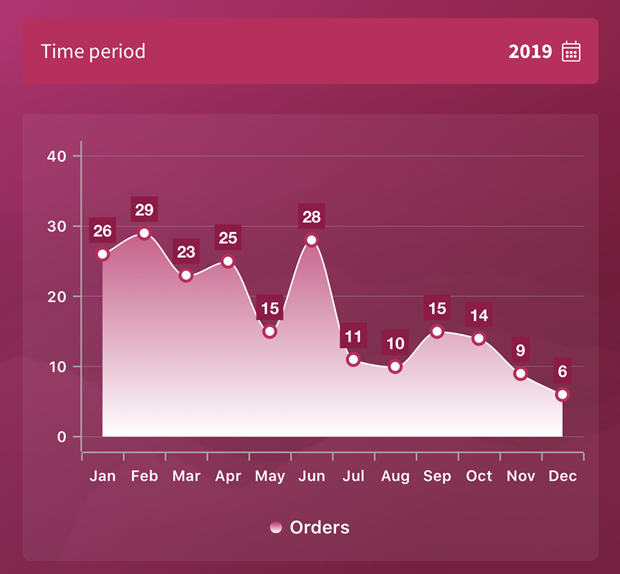
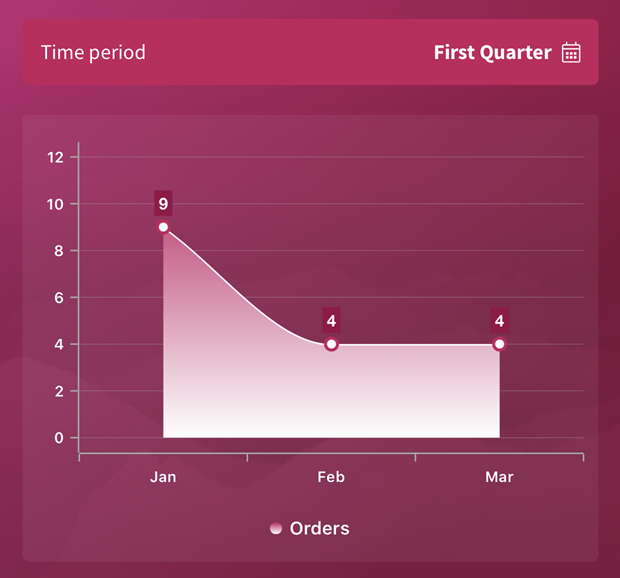
ORDERS
Total number of orders that were sold during the selected time period.
DAYS LISTED / SALE
Average number of days listed on Poshmark before it sells.
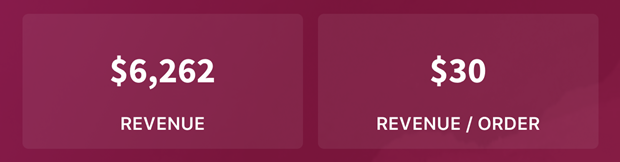
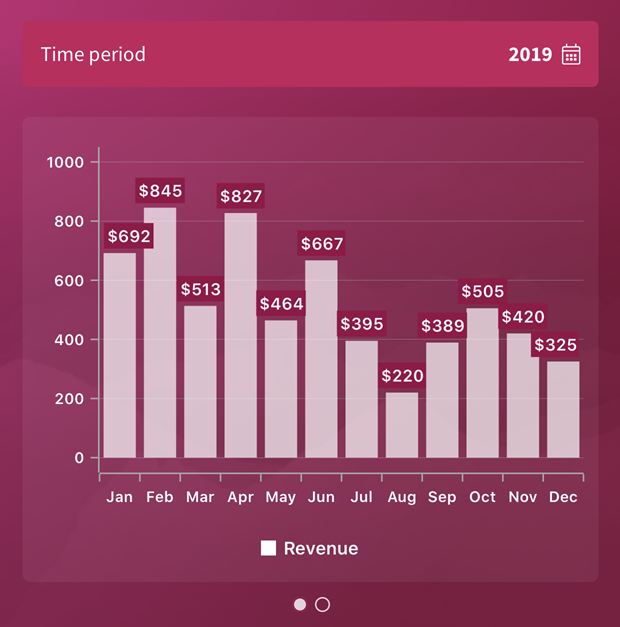
REVENUE
Total revenue earned during the selected time period.
REVENUE / SALE
Average revenue earned per sale during the selected time period.

PROFIT
Total profit during the selected time period.
PROFIT / SALE
Average profit per sale during the selected time period.
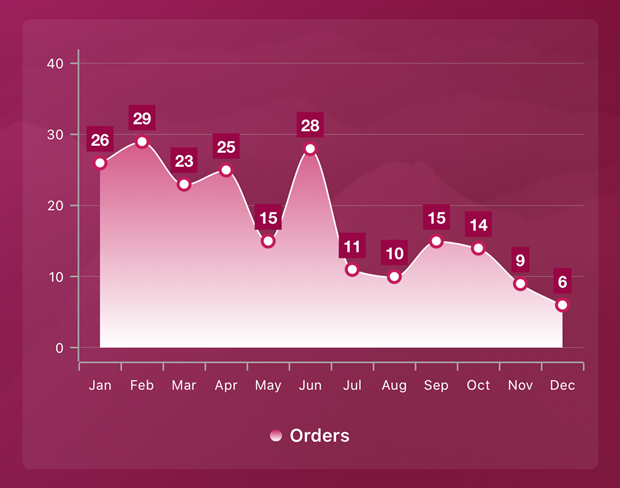
Visualize your Poshmark orders over time to quickly identify which months perform better than others!

COST
Total cost of all the items that sold during the selected time period.
COST / SALE
Average cost per sale during the selected time period.
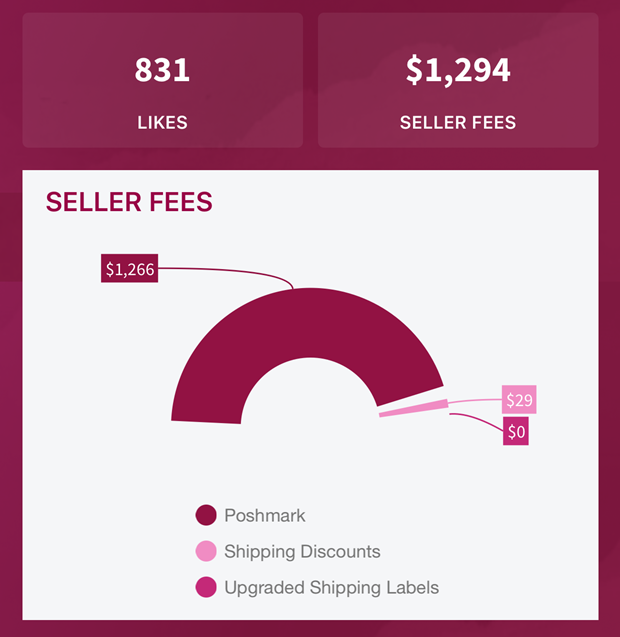
LIKES
Total likes of all the items that sold during the selected time period.
SELLER FEES
Total seller fees of all the orders sold during the selected time period.

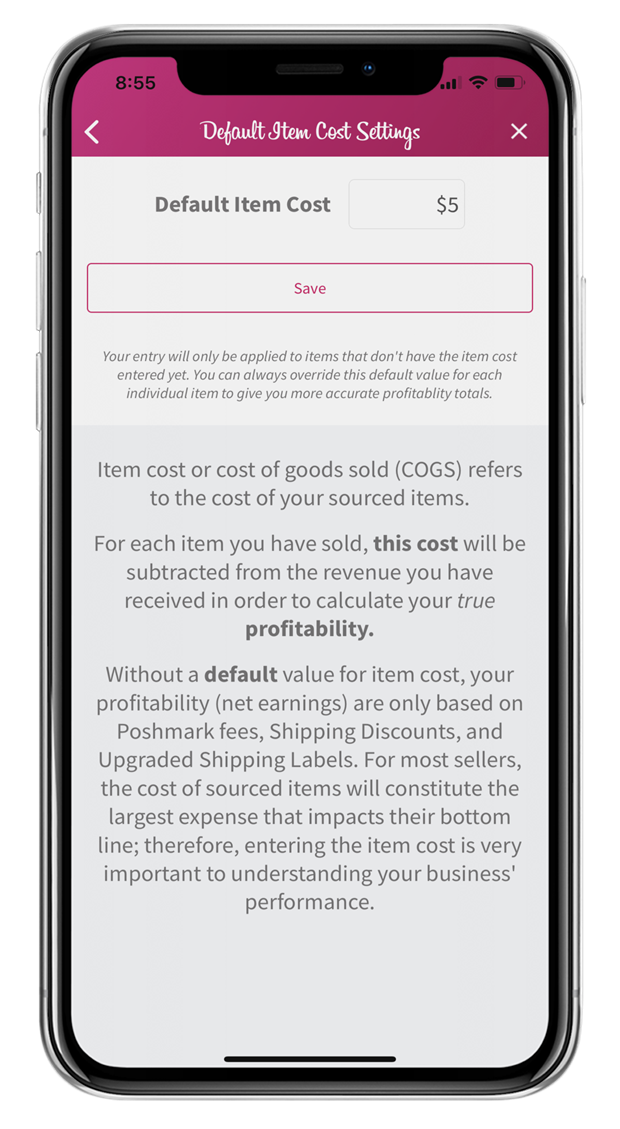
DEFAULT COST
Cost of Goods Sold (COGS) that is automatically applied to all the listings in your closet.
Use the time period picker to quickly cycle between various time periods such as: week to date, month to date , last 30 days, year to date, Q1-Q4, each year of imported sales data, and more!
Tap on the bar or point in the charts to gain even more insight in that particular set of data!
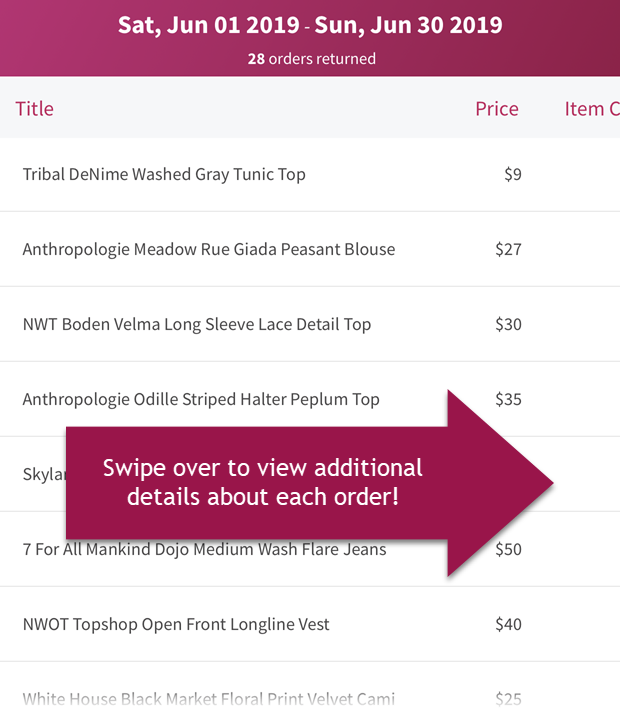
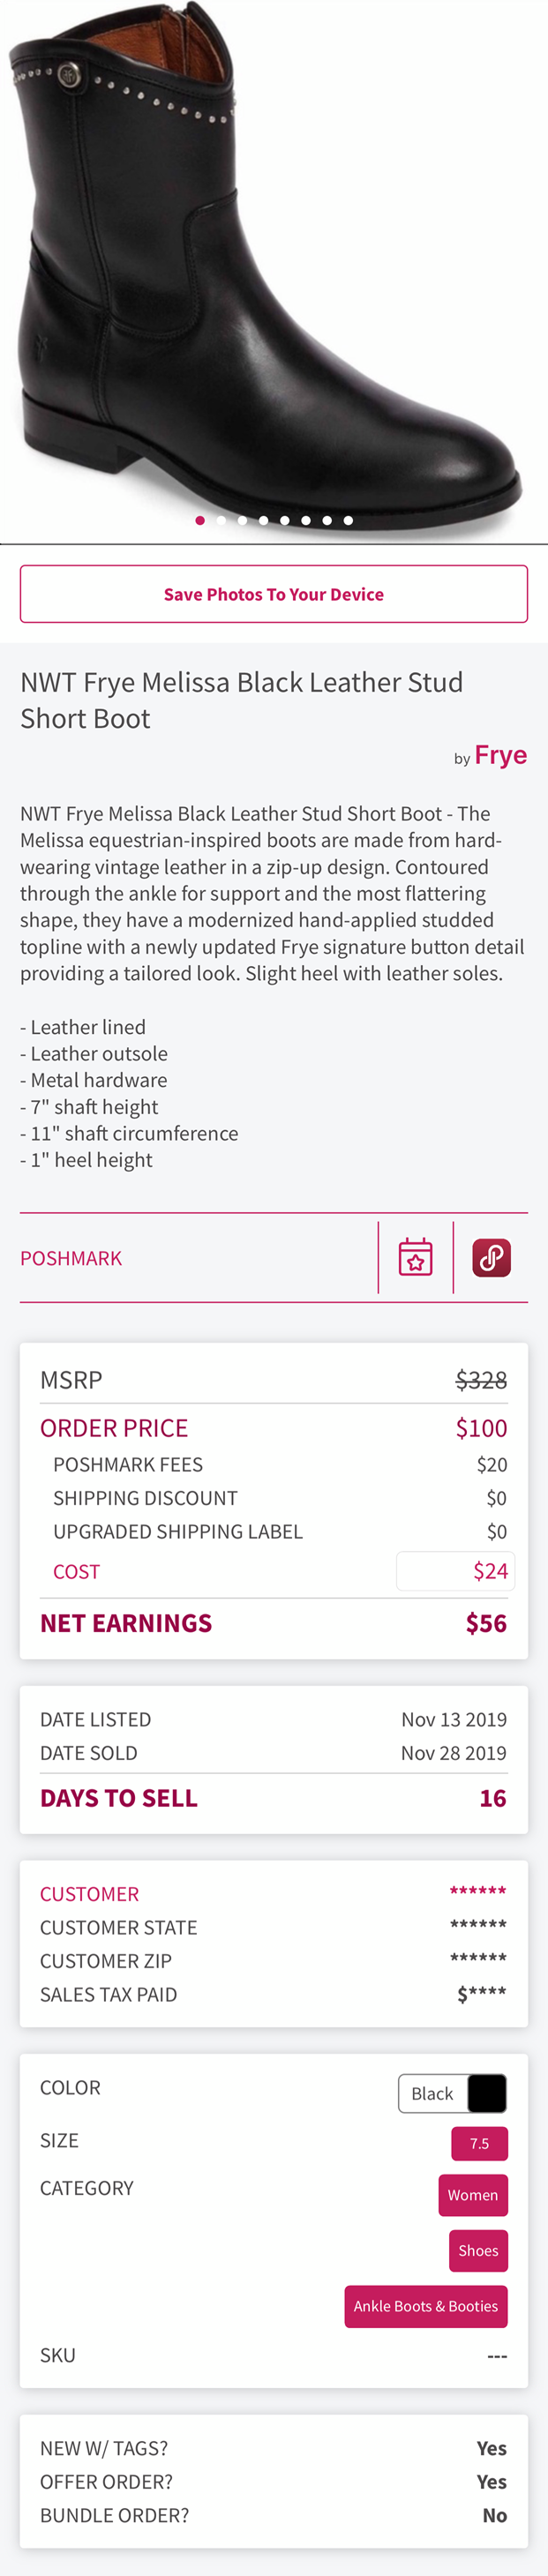
Tap on the the listing in the table to see even more details about that specific listing!
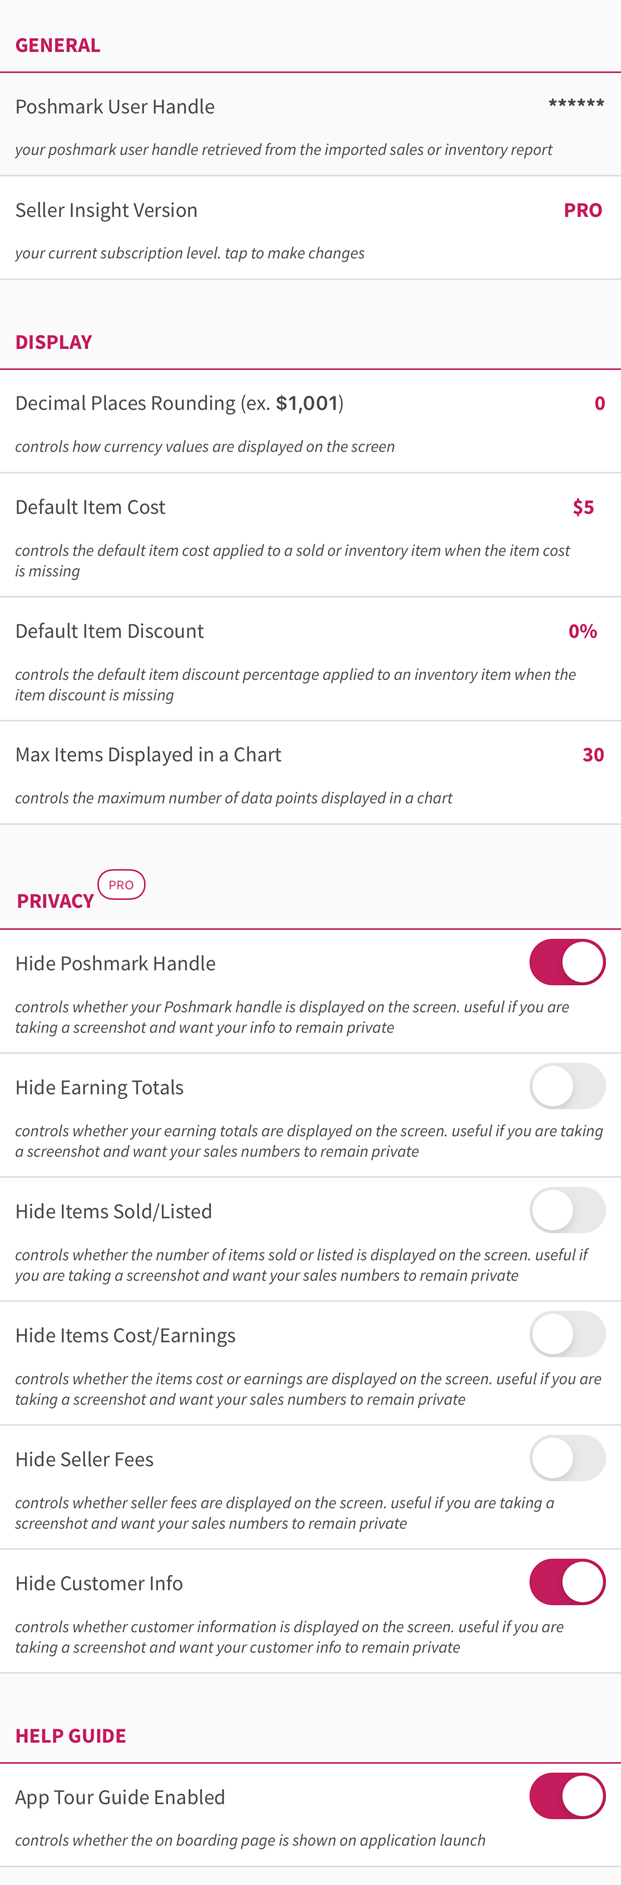
Don't forget that you have access to additional settings at your fingertips.